 Disney crowd forecast
 🎆 [Watching the parade] 9 show slots start where the rides top out — a second budget?
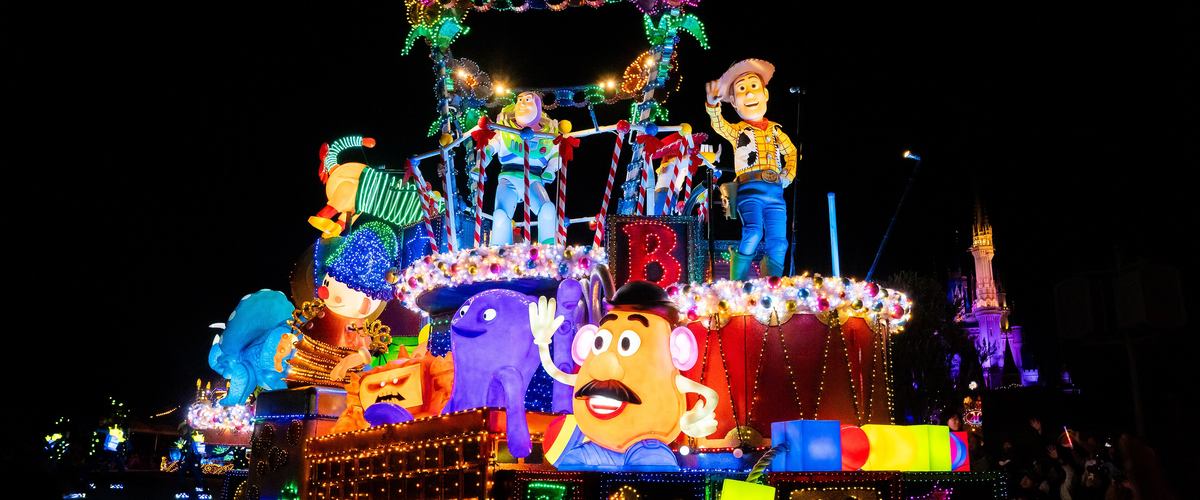
Premier Access reads as a way to skip a ride queue. Split the price list by ledger and a second one appears: shows and parades, priced above every attraction on the sheet. This article is about that half.
Premier Access runs on two ledgers, not one. As of Sep 2, 2026 it covers 16 attractions and 9 shows and parades. Attractions run ¥1,000 to ¥2,500; shows run ¥2,500 to ¥3,500. The ceiling on the whole sheet belongs to the show side.
Prices are as of Sep 2, 2026; source: Impress Travel Watch(2026-08-31)/dtimes(2026-08-24)/temapa(2026-08-25)/castel(2026-08-21). Coverage and amounts move with each revision, so check the official page before you go. The chart below estimates how far an attraction queue stretches at each crowd level; it does not apply to the show slots. The levels themselves are our forecast.
🎭 Premier Access has 9 show slots too!
The Sep 2, 2026 price list comes in two halves: 16 attractions and 9 shows and parades. Same name, separate ledgers.
The price bands are separate as well. Attractions run ¥1,000 to ¥2,500; shows and parades run ¥2,500 to ¥3,500. The show band sits on top of the attraction band, not inside it.
💰 The cheapest show costs what the dearest ride does!?
The show side starts at ¥2,500, which is the exact figure the attraction side tops out at. The cheapest show slot is priced level with the dearest ride.
So the show ledger begins where the ride ledger ends. Adding one show "while we are here" adds a top-priced ride to the bill. That single slot is where most estimates go wrong.
🧮 Still budgeting everything at ¥3,500?
The sheet as a whole runs ¥1,000 to ¥3,500. Only the show side reaches that ceiling; attractions stop at ¥2,500.
Apply the full range to 16 attractions and the estimate comes out too high. Price a show slot at the attraction ceiling and it comes out short. The list itself is what Premier Access covers; the envelope is budgeting for Premier Access.
| Level | Land | Sea |
|---|---|---|
| Wide open | 25min | 30min |
| Easy | 40min | 45min |
| Fairly easy | 55min | 60min |
| Normal | 80min | 95min |
| Fairly busy | 95min | 110min |
| Busy | 120min | 140min |
| Packed | 135min | 155min |
Longest wait, roughly
🧭 Decide which ledger you are opening!
The date moves the attraction side. The chart above estimates the longest queue at each level: on a Wide open day Tokyo Disneyland reaches 25 minutes, on a Packed day 135. DisneySea runs 30 and 155.
On a 25-minute day the attraction ledger can stay shut. The show ledger does not read off that chart at all — the minutes we hold are ride queues. The quiet dates are in the quietest days.
Last updated: 2026-09-11