 Disney crowd forecast
 🔧 [If your dates can move] Of the 9 closures, how many can you wait out?
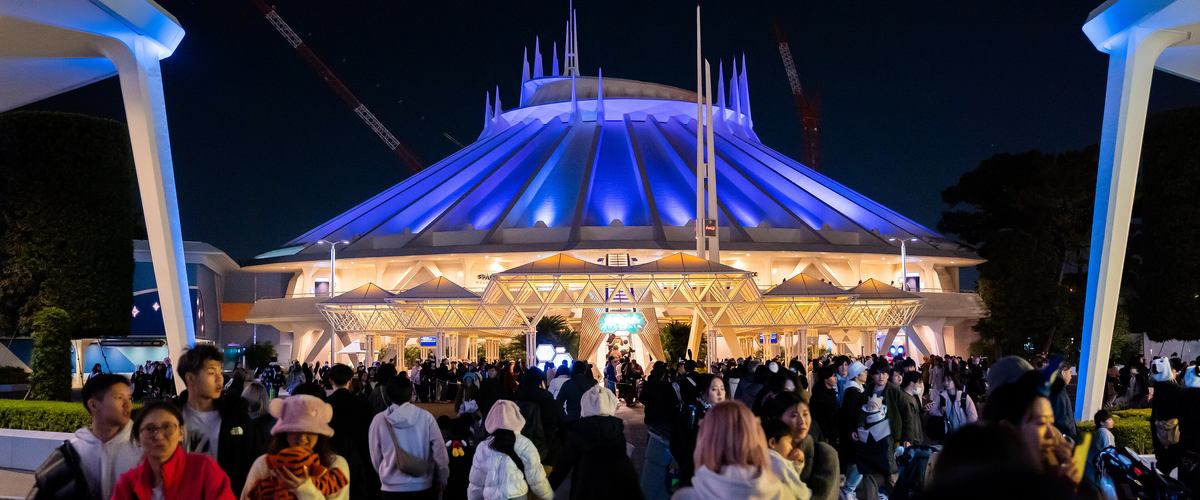
A closure with an announced return date is a published fact, unlike a crowd level, which is our estimate. Push the trip later and the number of attractions running that day changes. That check comes before hunting for a lower level.
If your dates can move, a closure is something to wait out rather than avoid. As of today 5 attractions are closed at Disneyland and 4 at DisneySea, 9 in all. The next to reopen is Sep 14, 2026 at Disneyland and Sep 14, 2026 at DisneySea. But 2 of them have no announced return at all, and those cannot be waited out.
The figure below is the wait guide by crowd level, and it makes no allowance for anything being closed. The level on a date is something we predict; the closure periods come from the official operating calendar (東京ディズニーリゾート 公式の運営カレンダー(休止情報)). We do not carry the names of the closed attractions, so check those on the official calendar.
🔧 A reopening date is published; a level is not!
Right now 5 attractions are closed at Disneyland and 4 at DisneySea, 9 together, none of them running today.
The crowd level is our forecast, while the return date came from the park itself. As something to plan against, the second is firmer. Our copy of the closures runs to Jul 26, 2026 for Disneyland and Aug 26, 2026 for DisneySea.
📅 Move the trip later and the day changes!?
The next reopening is Sep 14, 2026 at Disneyland and Sep 14, 2026 at DisneySea. The furthest announced returns are Oct 22, 2026 and Nov 30, 2026.
If your date sits just short of one of those, sliding it later adds a working attraction outright. That can be worth more to the day than dropping the crowd by one level.
This next part is opinion. The trade looks worth making when the reopening lands just beyond the date you were holding, and not when it sits far past it.
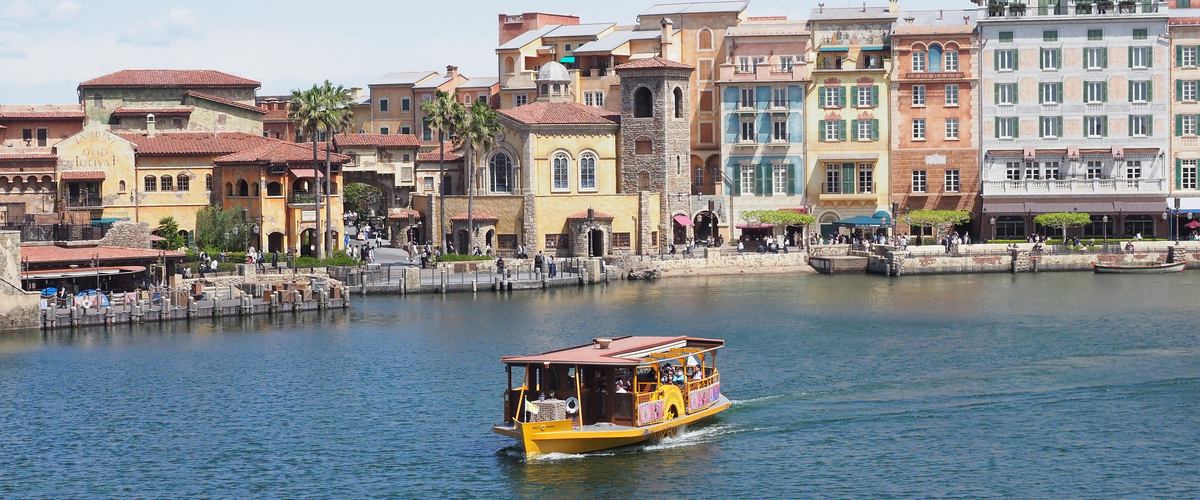
🤔 When is moving the wrong call?
1 closures at Disneyland and 1 at DisneySea have no announced return — 2 in all. Nothing about those can be planned around, so they are not worth betting a date on.
And if the later date is a busier one, you lose more than the attraction gives back. Moving pays only when the new date holds the same level or a lower one. The low dates are listed in the quiet days.
| Level | Land | Sea |
|---|---|---|
| Wide open | 25min | 30min |
| Easy | 40min | 45min |
| Fairly easy | 55min | 60min |
| Normal | 80min | 95min |
| Fairly busy | 95min | 110min |
| Busy | 120min | 140min |
| Packed | 135min | 155min |
Longest wait, roughly
🚧 Where does the closed queue go?
The natural expectation is that the line which would have formed at a closed attraction spreads across the ones still running. That is an expectation, not something we measured across a closure.
The guide below carries no allowance for it either: at the quietest level Disneyland tops out near 25 minutes, at the busiest around 135 minutes.
With fewer places to go, the real day should run harder than that — and that is as far as the claim goes. For the queues themselves, see the longest waits.
🧭 Level, then reopening, then names!
Narrow to the low-level dates first, lay the reopening dates over them, and check the names last on the official calendar. We hold counts and periods only, never the names.
The current count is broken down in closed attractions, and if the dates truly cannot move, when Premier Access (DPA) is worth buying takes over.
Last updated: 2026-09-03