 Disney crowd forecast
 ⚖️ [Land or Sea?] 9 minutes between the averages, and still no ranking?
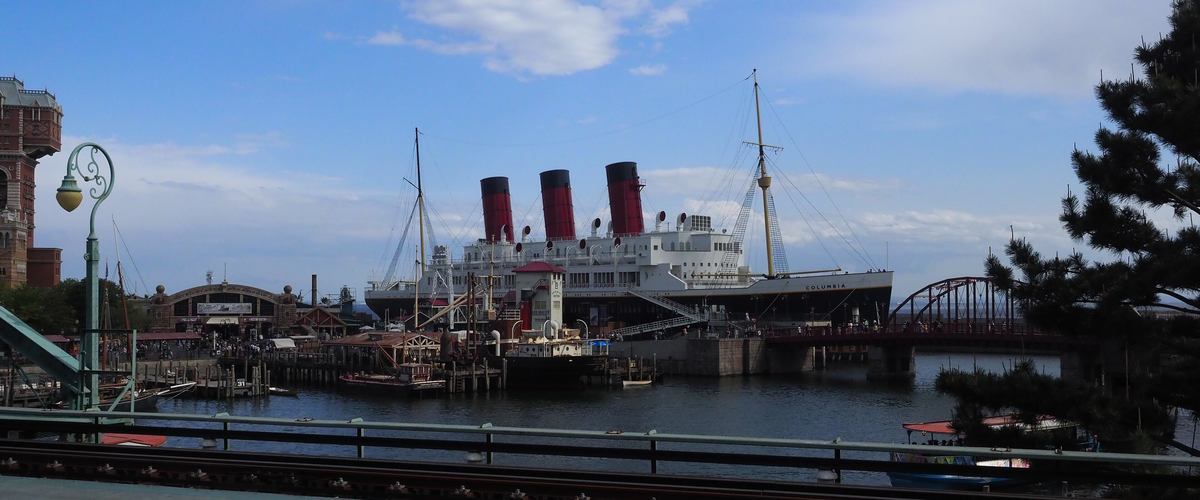
Which park is busier is not a question the yearly averages answer. Levels do come apart on individual dates, but flatten the year and the two land in the same place. What this article works through is the measured wait snapshot instead.
In one snapshot taken at a single moment, 26 attractions were posting a wait at Tokyo Disneyland and 23 at DisneySea. The averages came out at 38 and 47 minutes, 9 minutes apart. 5 queues were over an hour at Land against 6 at Sea. Across the year the two parks average the same crowd level, so the comparison here lives inside this one snapshot.
The minutes in the table below stretch that one snapshot by the crowd level. The two parks differ there because each is anchored to its own measured reading. Levels do split on some dates, but over the year they average the same. The figures are one measured snapshot from Aug 30, 2026, not a daily average and not a forecast. Wait times come from Queue-Times.com (https://queue-times.com/).
⚖️ 9 minutes apart at the same moment!
At that moment on Aug 30, 2026, 26 attractions were posting a wait at Land and 23 at Sea. The averages read 38 minutes and 47 minutes.
The longest queue was The Happy Ride with Baymax at 120 minutes and Soaring: Fantastic Flight at 140, a gap of 20 minutes. Both readings were taken at the same moment, so they sit on the same footing.
🔭 That still does not make Sea the busier park!?
Levels do come apart on individual dates, but flatten the year and the two average the same. So once the year is flattened, neither park comes out as the busier one.
What is being compared here is one snapshot from Aug 30, 2026, and nothing else. So this article can say what that moment looked like, and nothing about which park runs busier. The dates where the levels themselves split are in Land vs Sea crowd levels; how the levels read covers how a level is built.
| Level | Land | Sea |
|---|---|---|
| Wide open | 25min | 30min |
| Easy | 40min | 45min |
| Fairly easy | 55min | 60min |
| Normal | 80min | 95min |
| Fairly busy | 95min | 110min |
| Busy | 120min | 140min |
| Packed | 135min | 155min |
Longest wait, roughly
📊 Do more attractions mean more waiting?
Land posted 3 more attractions than Sea. Even so, 16 of them (62%) sat at half an hour or less, against 13 at Sea (57%) — the larger share was at Land.
Over the hour mark it runs the other way: 5 at Land (19%) and 6 at Sea (26%). How many attractions a park has and how much waiting it holds move separately.
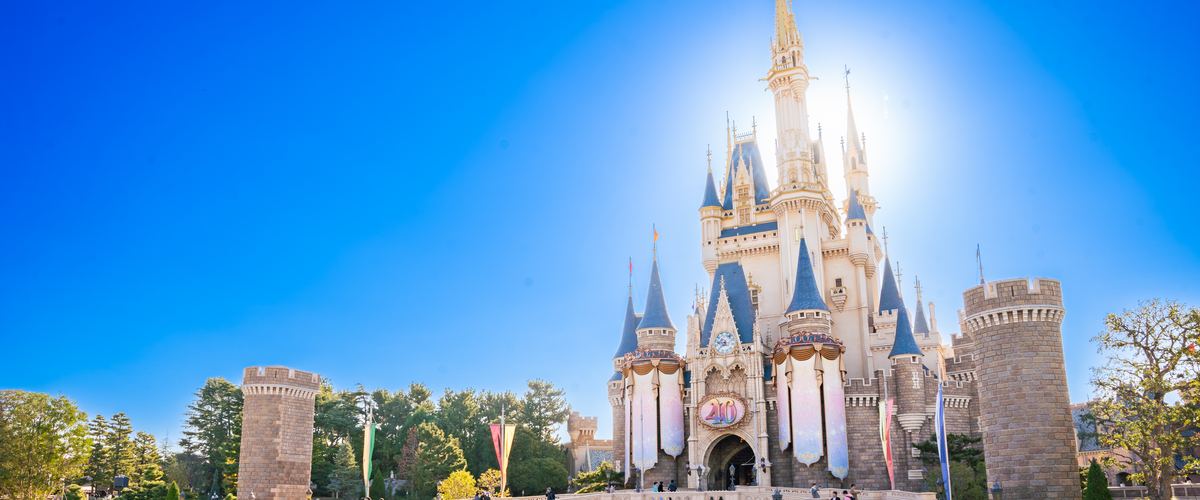
🎢 A few queues at the top carry the average!
Between the longest queue and the park average sit 82 minutes at Land and 93 at Sea. In neither park does the front of the list stand anywhere near the average.
That 9 minute gap between the averages is mostly decided by how far the top few had stretched. The DisneySea side breaks that park down, and the longest queues names the long lines across both.
🗓️ Pick the date, not the park!
A higher level stretches the minutes at both parks. Switching dates moves far more than switching parks does.
The quiet dates lists what each date carries. The two gates can carry different levels on the same day, and Land vs Sea crowd levels breaks that down.
Last updated: 2026-09-03