 Disney crowd forecast
 🗺️ [Area by area] 50 minutes between the longest and shortest area?
If waiting were a property of the area, picking a corner of the park would settle the day. Split one measured snapshot area by area and what moves the averages is not how far in an area sits, but how many attractions it holds.
Every number here comes from one snapshot, taken at a single moment on Aug 30, 2026. It is not an average, not a typical day, not a forecast. We split 46 attractions across the 13 areas that hold at least two of them. Between the longest and shortest area average sit 50 minutes.
The wait data carries no area names, so we matched each attraction to an area by hand, and the labels are stored in Japanese. Anything we could not match falls into a generic bucket, and areas with a single attraction are dropped, so these averages are indicative. The figures are one measured snapshot from Aug 30, 2026, not a daily average and not a forecast.
🗺️ The averages split by area!
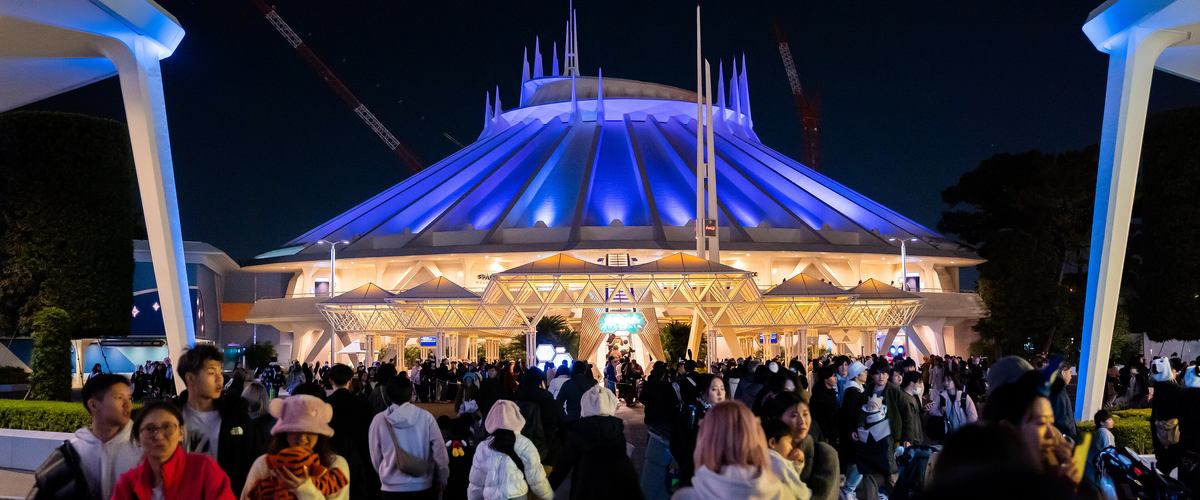
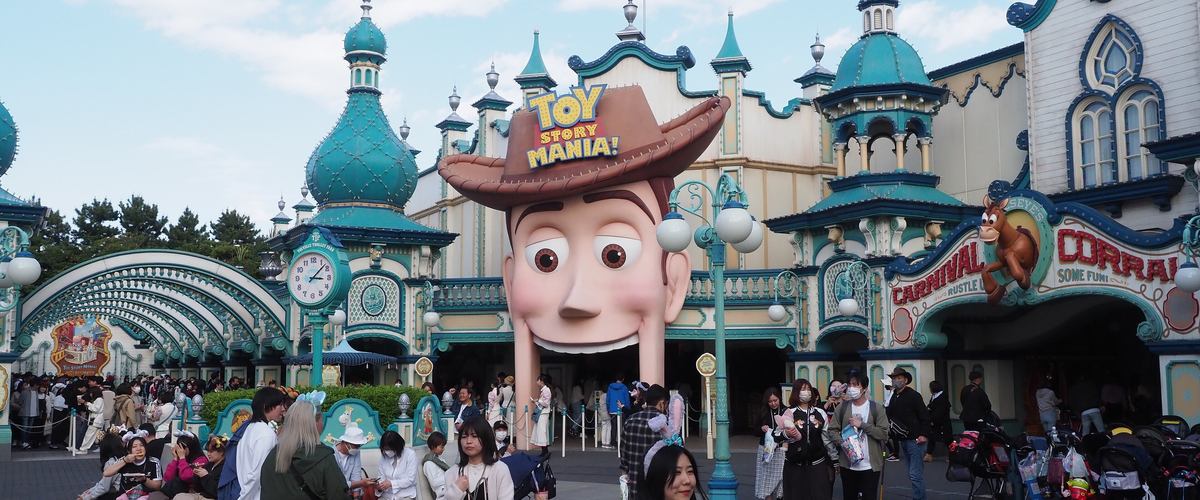
At that moment the longest area average was at Land, labelled Tomorrowland in our data: 68 minutes across 4 attractions. The shortest was at Land, labelled Toontown: 18 minutes across 6.
That is a 50 minute spread between areas. It is one snapshot split up, not a ranking that repeats every day.
📐 An average over 2 is not an average over 7!?
The split covers 13 areas and 46 attractions. The counts are lopsided: the largest area holds 7 attractions, the smallest only 2.
An average built on 2 attractions flips the moment one long line lands in it. So reading the areas in order and calling the top one busy does not hold up. For reference, the largest area averaged 35 minutes.
| Level | Land | Sea |
|---|---|---|
| Wide open | 25min | 30min |
| Easy | 40min | 45min |
| Fairly easy | 55min | 60min |
| Normal | 80min | 95min |
| Fairly busy | 95min | 110min |
| Busy | 120min | 140min |
| Packed | 135min | 155min |
Longest wait, roughly
🏷️ Where do the area labels come from?
The wait data has no area field, so we matched attractions to areas by hand. Anything that did not match went into one generic bucket.
Areas holding a single attraction were dropped, since an average of one says nothing; that leaves 3 attractions outside the split. Taken together, these area averages are indicative, not an exact ranking.
🎯 The long lines are not in one corner!
Counting where the 6 longest queues sat in the same snapshot, they were spread across 5 areas at Land and 5 at Sea.
A high area average and a cluster of long lines are not the same thing. Those queues get named one by one in the longest queues.
🗓️ The lever is the date, not the area!
A busier day lifts every area at once. Our forecast stretches this one snapshot by tier, so the order between areas does not change with the tier.
What changes is the minutes. How we grade crowd levels explains how the tiers are built. Everything here is a single reading from Aug 30, 2026 and is not the wait you will get.
Last updated: 2026-09-02