 Disney crowd forecast
 🚧 [Before you pick a date] 9 attractions are shut right now — does that change your day?
A crowd level describes the crowd and nothing else. Pick the quietest date on the calendar and the ride you came for can still be standing still. Start instead with how many attractions are down, and how many have a date to come back.
A date is worth more than its crowd level says. Today 5 attractions are down at Tokyo Disneyland and 4 at DisneySea, 9 in all. For 2 of them, no return date has been announced. Our closure data runs to Jul 26, 2026 for Land and Aug 26, 2026 for Sea.
The chart below is a guide to how long the longest queue runs at each crowd level. It stretches one measured snapshot by level, so it is not the wait on any given day. Closure periods come from official notices; the names of the attractions are not something we hold.
🚧 9 attractions are down across both parks!
5 are closed at Tokyo Disneyland and 4 at DisneySea. That is 9 rides not running as of today.
The crowd level describes the crowd, nothing else. Days at the same level can have very different numbers of attractions open. Which ones are down is on the official park calendar — we hold the periods, not the names.
🗓️ Some have no announced return date!?
No end date is announced for 1 at Land and 1 at Sea — 2 in total. That is not "back soon", it is "no date set".
The next reopening is Sep 14, 2026 at Land and Sep 14, 2026 at Sea. The furthest one announced is Oct 22, 2026 at Land and Nov 30, 2026 at Sea.
Lock the date first and you have nowhere to go when those dates move. Read them before you book.
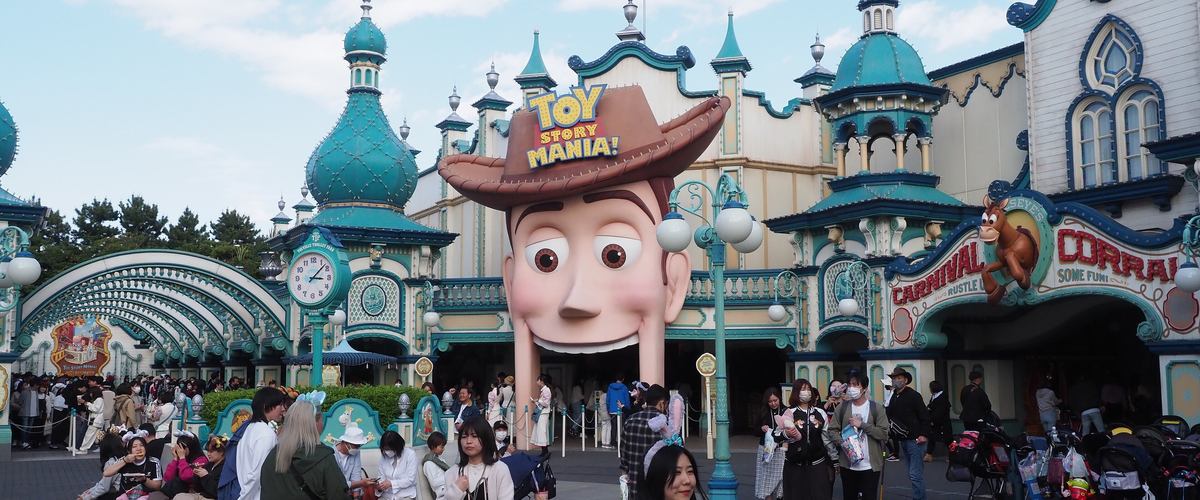
🤔 What does a closure do to the queues?
The queue that would have gone into a closed attraction has to go somewhere, and the obvious somewhere is the rides still running. That is what we expect, not what we measured. We do not yet have a before-and-after comparison of waits around a closure.
So we treat closures as a reason the same level can feel different. The chart below does not account for them. With fewer places to go, expect the real day to run tighter than the guide.
| Level | Land | Sea |
|---|---|---|
| Wide open | 25min | 30min |
| Easy | 40min | 45min |
| Fairly easy | 55min | 60min |
| Normal | 80min | 95min |
| Fairly busy | 95min | 110min |
| Busy | 120min | 140min |
| Packed | 135min | 155min |
Longest wait, roughly
🧭 Read crowds and closures together!
The order matters. Shortlist the low-crowd dates first, then lay the official closure list over them. Do it the other way round and you land a quiet day with the ride you came for switched off.
The longest waits shows how far the queues stretch. Whether to buy Disney Premier Access (DPA) on a closure-heavy day is the case we make in when you need DPA.
Last updated: 2026-09-02