 Disney crowd forecast
 ✨ [The new area] The newest area averaged 4 minutes under its park?
The area built last is the one everybody braces for. Split a single measured snapshot area by area and it averages below the park as a whole, and none of its queues turn up among the longest in that reading.
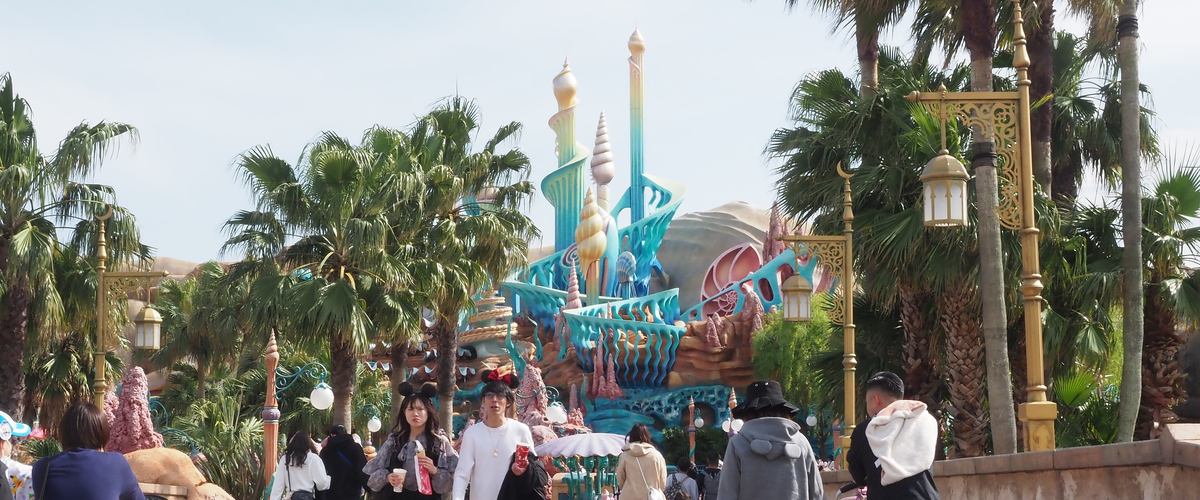
Split area by area, the newest area held 3 attractions posting a wait. They averaged 43 minutes, 4 below the 47 minutes across DisneySea. None of the 6 longest queues in the park came from this area. All of it is one snapshot, taken at a single moment on Aug 30, 2026.
The minutes in the table below stretch that one snapshot by the crowd level, as a guide to the size of the queue. The wait data carries no area names, so we matched each attraction to an area by hand. The figures are one measured snapshot from Aug 30, 2026, not a daily average and not a forecast. Wait times come from Queue-Times.com (https://queue-times.com/).
✨ The newest area came in under the park average!
At that moment on Aug 30, 2026, 3 attractions in Fantasy Springs were posting a wait, averaging 43 minutes.
DisneySea as a whole averaged 47 minutes in the same reading. The newest area sat 4 minutes below its own park. Among the 7 named areas it ranks 4.
🔝 Not one of the 6 longest!?
Line up the 6 longest queues at DisneySea in that snapshot and not one of them stands in Fantasy Springs. The top of that list is Soaring: Fantastic Flight at 140 minutes, in another area.
Newest does not put an area at the front of the list. It is one moment's ranking, and a different hour reshuffles it.
| Level | Land | Sea |
|---|---|---|
| Wide open | 25min | 30min |
| Easy | 40min | 45min |
| Fairly easy | 55min | 60min |
| Normal | 80min | 95min |
| Fairly busy | 95min | 110min |
| Busy | 120min | 140min |
| Packed | 135min | 155min |
Longest wait, roughly
🗺️ So which areas were longer?
3 areas averaged longer. The top was Mysterious Island at 63 minutes over 2 attractions, then American Waterfront at 60 over 5 — 20 minutes above the newest area.
An average built on 2 attractions flips the moment one long line lands in it. Waits by area sets out what area averages can and cannot carry, and the DisneySea side shows how the park splits overall.
🎟️ Whether to buy here depends on the queue!
You can buy the wait down. As of Sep 2, 2026, Premier Access (DPA) covers 16 attractions across both parks at ¥1,000 to ¥2,500.
In this snapshot the 3 attractions in the area averaged 43 minutes, below the park as a whole. The price moves with neither the date nor the queue; only the queue you skip gets shorter. When you need DPA draws that line.
🗓️ The date moves it, not the area!
Our forecast stretches this one snapshot by the level. The order between areas does not change with the level; the minutes do.
So steering around the newest area does not cut the wait. Choosing a lower level does. How the levels read explains what each level means in minutes.
Last updated: 2026-09-03