 Disney crowd forecast
 ⏳ [Worried about queues] Only 11 of 49 rides were over an hour?
The waiting is not spread evenly across the park. Counted across both parks in one measured snapshot, the long lines sit on a handful of attractions while the rest never stretch that far.
Of the 49 attractions posting a wait across both parks, only 11 were over an hour. The longest read 120 minutes at Land and 140 at Sea. The other 38 had not got there. That is one measured snapshot, taken at a single moment on Aug 30, 2026.
The wait figures are one measured snapshot, taken at a single moment on Aug 30, 2026, not a daily average and not a forecast. The table below stretches that one snapshot across the crowd tiers as a guide to relative length. Wait figures come from Queue-Times.com (https://queue-times.com/).
⏳ A handful of rides carry the queue!
At that moment the longest line at Land was The Happy Ride with Baymax at 120 minutes, and at Sea Soaring: Fantastic Flight at 140 minutes. Those are the numbers on the board at one instant, nothing more.
The waiting is not spread across the park. The top 6 hold 56% of all posted minutes at Land and 58% at Sea, out of 26 and 23 attractions measured.
⌛ Only 11 rides passed an hour!?
Across both parks, 49 attractions had a wait posted. 11 of them, 22%, sat at 60 minutes or more: 5 at Land and 6 at Sea.
The other 38 had not reached an hour at that moment. A busy day still gets described almost entirely through those 11.
| Level | Land | Sea |
|---|---|---|
| Wide open | 25min | 30min |
| Easy | 40min | 45min |
| Fairly easy | 55min | 60min |
| Normal | 80min | 95min |
| Fairly busy | 95min | 110min |
| Busy | 120min | 140min |
| Packed | 135min | 155min |
Longest wait, roughly
🚶 A long ride list is not a long wait!
Read the same snapshot from the other end: 16 of 26 attractions at Land and 13 of 23 at Sea were sitting at 30 minutes or less. Across both parks that is 29 of 49, or 59%.
The bottom was Donald's Boat at 5 minutes at Land, Big City Vehicles at 5 at Sea. How many attractions post a wait and how much waiting there is are two different quantities. The tier reaches a narrower slice of a visit than the length of the list implies.
📊 What does the average tell you?
In the same snapshot the average was 38 minutes at Land and 47 at Sea, against peaks of 120 and 140.
An average tells you nothing about the one line you are about to join. The table below stretches the snapshot across the tiers, and how we grade crowd levels walks through how those tiers are built.
🔁 The order is one frozen frame!
The ranking inside the top 6 is the order at a single instant. Another hour would reshuffle it, so one snapshot cannot tell you which ride is busiest in general.
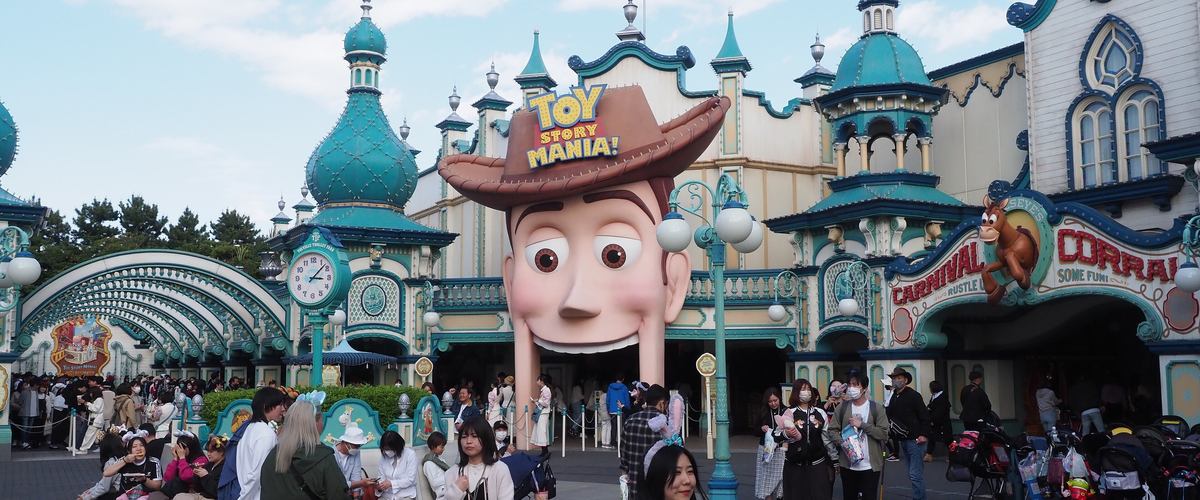
What holds is the shape, not the order: the same few names sit at the top. Lines like Enchanted Tale of Beauty and the Beast and Toy Story Mania! are the ones our forecast stretches most as the tier climbs.
🗓️ Your date does the work!
The rides at the top are where a change of tier moves the most minutes. On a quiet tier the same ride lands near the short end of the table below. You can read the tiers date by date in the quiet days.
You can also buy the wait down with Disney Premier Access (DPA). As of Sep 2, 2026 it runs ¥1,000 to ¥2,500. Outside the top few, the case for buying gets thin. Where we draw the DPA line is in when you need DPA.
Last updated: 2026-09-02