 Disney crowd forecast
 🌊 [Heading to DisneySea] Only 4 of 23 queues sat in the middle?
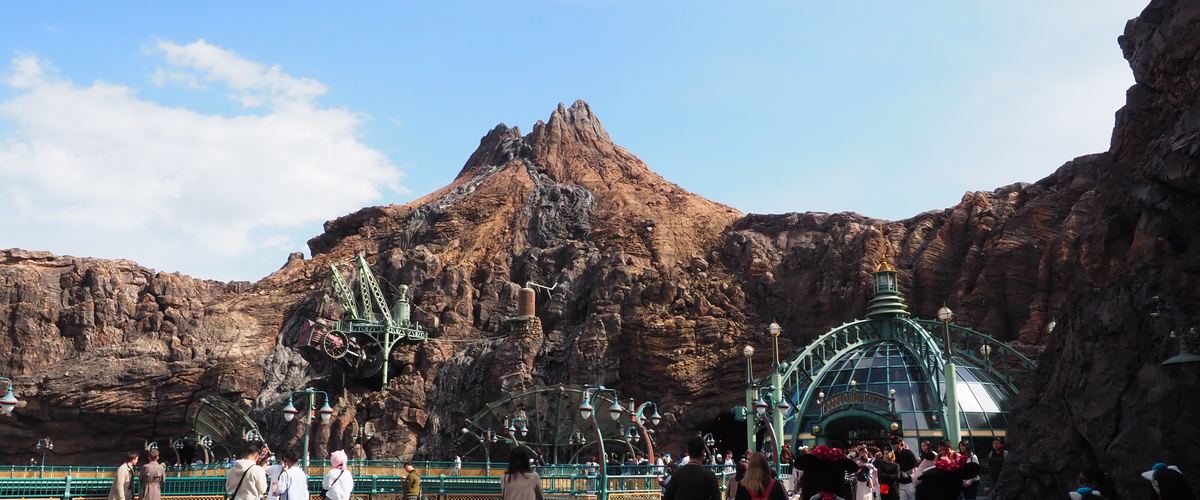
The waiting at DisneySea does not spread itself evenly across the park. Counted in one measured snapshot, the queues split into a long end and a short end, with almost nothing standing in the middle.
23 DisneySea attractions were posting a wait, averaging 47 minutes. The longest read 140 minutes, the shortest 5. 6 were over an hour and 13 at half an hour or less, which leaves 4 in between. All of it comes from one snapshot taken at a single moment on Aug 30, 2026.
The minutes in the table below stretch that one snapshot by the crowd level, as a guide to the size of the queue. The figures are one measured snapshot from Aug 30, 2026, not a daily average and not a forecast. Wait times come from Queue-Times.com (https://queue-times.com/).
🌊 The longest queue was not alone!
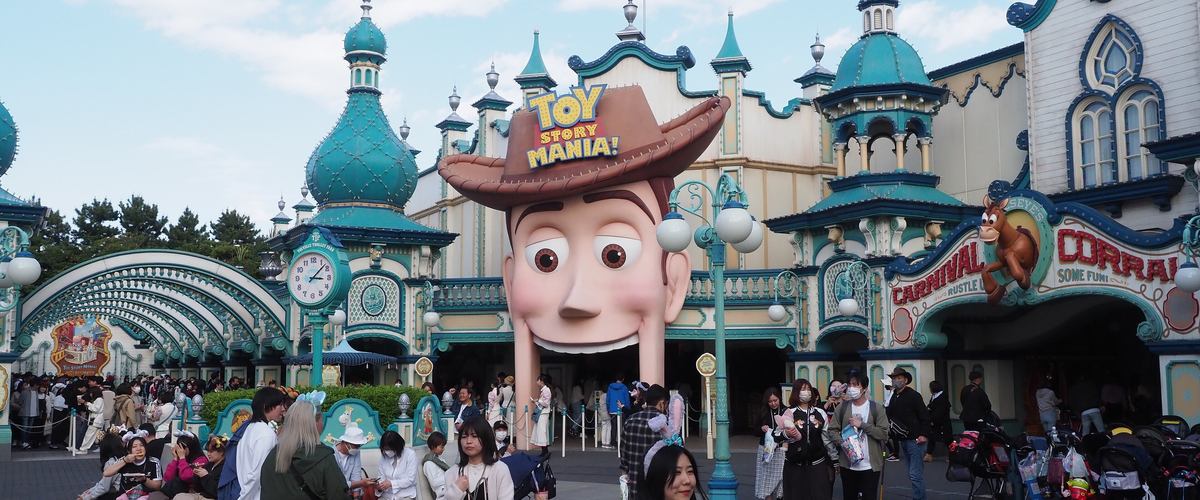
At that moment on Aug 30, 2026, 23 DisneySea attractions were posting a wait. The top of the list read 140 minutes, with Soaring: Fantastic Flight and Toy Story Mania! sitting on the same number.
The same snapshot averages 47 minutes. That is 93 minutes between the average and the front of the list. The average says nothing about the queue at that front.
🚶 13 of them at half an hour or less!?
In the same snapshot, 13 of the 23 were at 30 minutes or under, 57% of the park. The short end was Big City Vehicles at 5 minutes.
Against the 140 minutes at the top, that is a 135 minute spread. One park, one moment, queues that far apart.
| Level | Land | Sea |
|---|---|---|
| Wide open | 25min | 30min |
| Easy | 40min | 45min |
| Fairly easy | 55min | 60min |
| Normal | 80min | 95min |
| Fairly busy | 95min | 110min |
| Busy | 120min | 140min |
| Packed | 135min | 155min |
Longest wait, roughly
📊 Where did the middle go?
6 were over an hour (26%) and 13 at half an hour or less (57%). That leaves 4 attractions, 17%, in between.
The waiting piles up at both ends and thins out in the middle. Almost nothing was standing near the 47 minute average at that moment. How the levels read covers how far the level stretches those minutes.
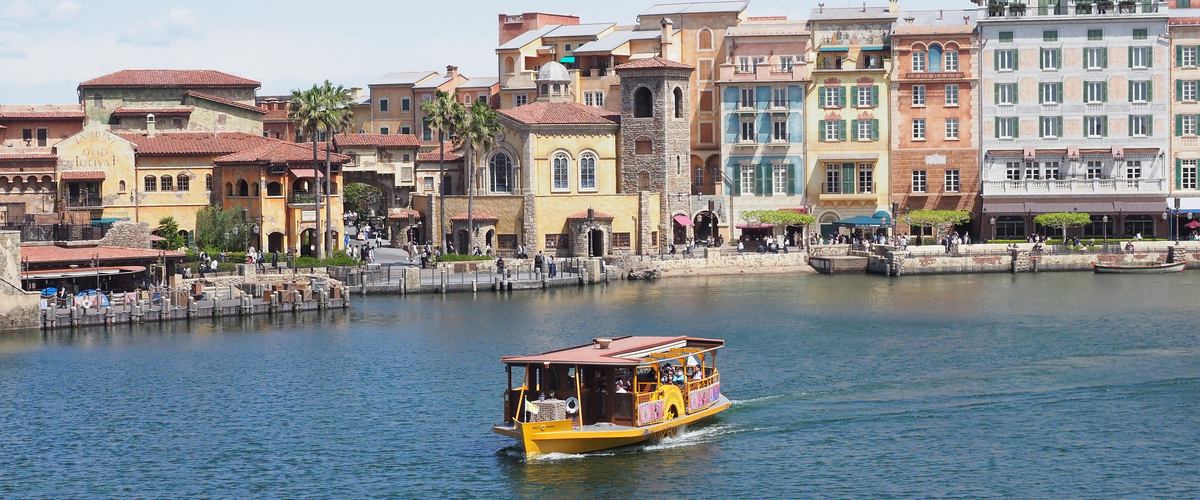
🗺️ Splitting by area keeps both ends!
Across the 7 named areas holding at least two attractions, 21 in all, the longest average was Mysterious Island at 63 minutes over 2, and the shortest Arabian Coast at 21 minutes over 4 — a 42 minute gap.
Even the largest area, American Waterfront, holds only 5. 3 of the 7 areas averaged above the park's own average; the rest sat below it. Waits by area explains how the areas are built, and the newest area's waits takes the one added last.
🗓️ The date is the lever!
Our forecast stretches this one snapshot by the level, and it stretches by multiplying. So a higher level moves the minutes most at the front of the list, on those 6 queues.
The 13 attractions at half an hour or less barely move when the level does. The quiet dates lists which dates carry which level.
Last updated: 2026-09-03